Guided Exercise: Monitor an OpenShift Cluster
I’ve been working in IT since 2009, starting as a system administrator and currently serving as a system engineer. My passion lies in building secure, reliable infrastructure — from enterprise systems to decentralized financial tools like Bitcoin multisig wallets and Shamir backups.
I write about system architecture, deployment strategies, security hardening, and self-custody in crypto. My mission is to help others design IT and financial systems that are resilient by default.
Assess the overall status of an OpenShift cluster by using the web console, and identify projects and pods of core architectural components of Kubernetes and OpenShift.
Outcomes
Explore and show the monitoring features and components.
Explore the Overview page to inspect the cluster status.
Use a terminal connection to the
master01node to view thecrioandkubeletservices.Explore the Monitoring page, alert rule configurations, and the
etcdservice dashboard.Explore the events page, and filter events by resource name, type, and message.
As the student user on the workstation machine, use the lab command to prepare your system for this exercise.
This command ensures that the cluster is prepared for the exercise.
[student@workstation ~]$ lab start intro-monitor
Procedure 1.2. Instructions
As the
developeruser, locate and then navigate to the Red Hat OpenShift web console.Use the terminal to log in to the OpenShift cluster as the
developeruser with thedeveloperpassword.[student@workstation ~]$ oc login -u developer -p developer \ https://api.ocp4.example.com:6443 ...output omitted...Identify the URL for the OpenShift web console.
 [student@workstation ~]$ oc whoami —show-console
 https://console-openshift-console.apps.ocp4.example.com
Open a web browser and navigate to https://console-openshift-console.apps.ocp4.example.com. Either type the URL in a web browser, or right-click and select
Open Linkfrom the terminal.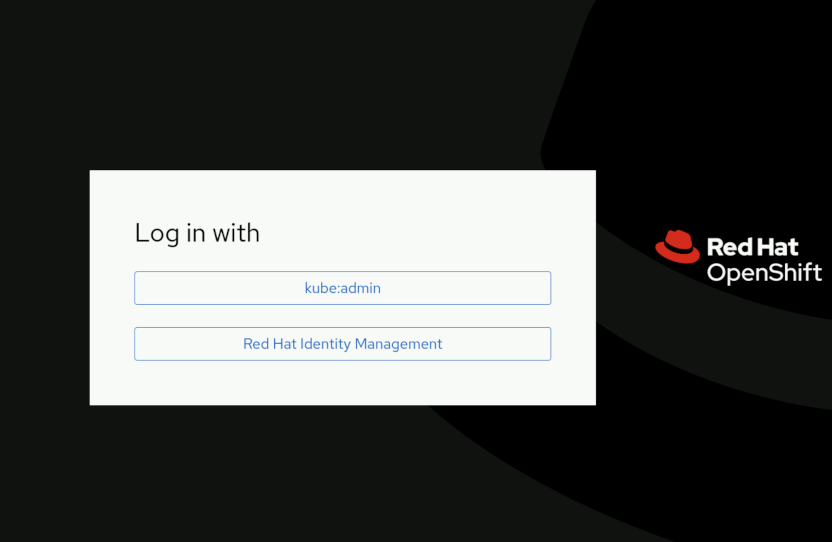
Log in to the OpenShift web console as the
adminuser.Click Red Hat Identity Management and log in as the
adminuser with theredhatocppassword.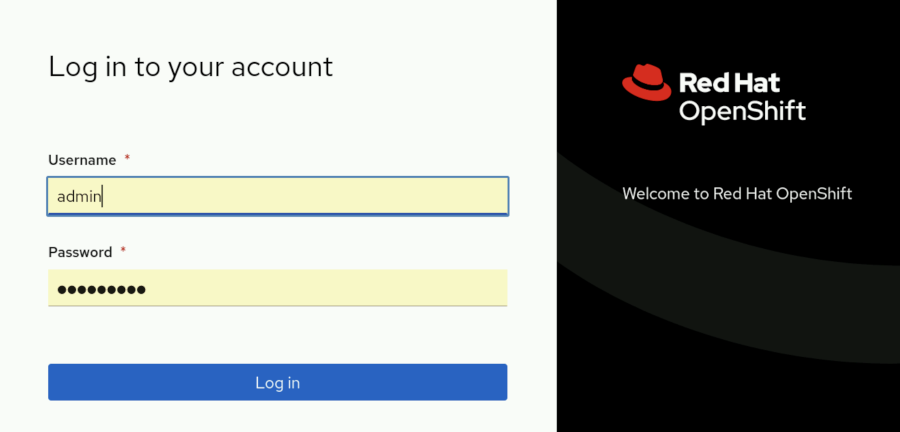
View the cluster health and overall status.
Review the
Cluster Overviewpage.If you do not see this page after a successful login, then locate the left panel from the OpenShift web console. If you do not see the left panel, then click the main menu icon at the upper left of the web console. Navigate to Home → Overview to view general cluster information.
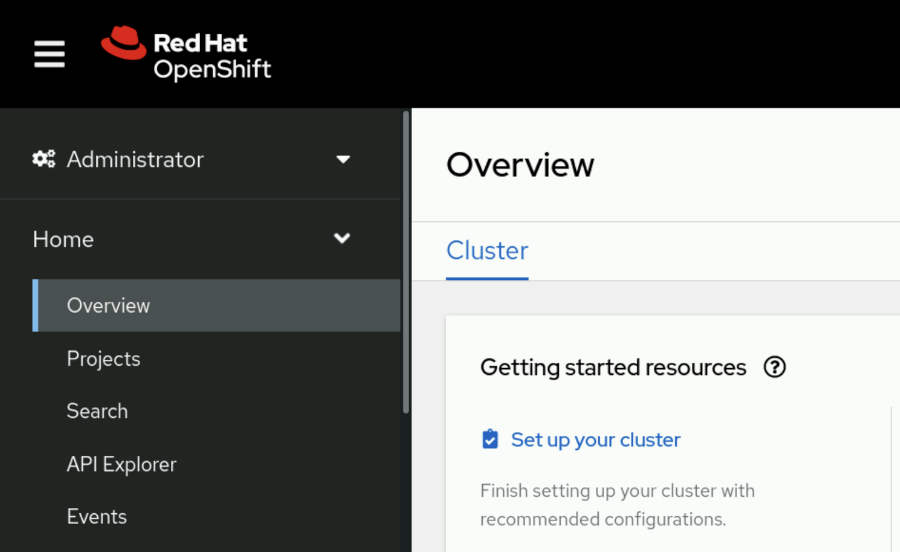
The top of this section contains links to helpful documentation and an initial cluster configuration walkthrough.
Scroll down to view the
Statussection, which provides a short summary of cluster performance and health.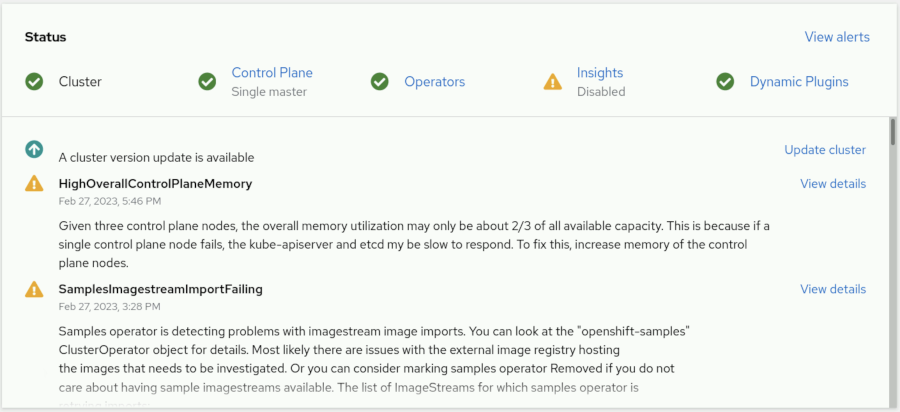
Notice that many of the headings are links to sections that contain more detailed cluster information.
Continue scrolling to view the
Cluster utilizationsection, which contains metrics and graphs that show resource consumption.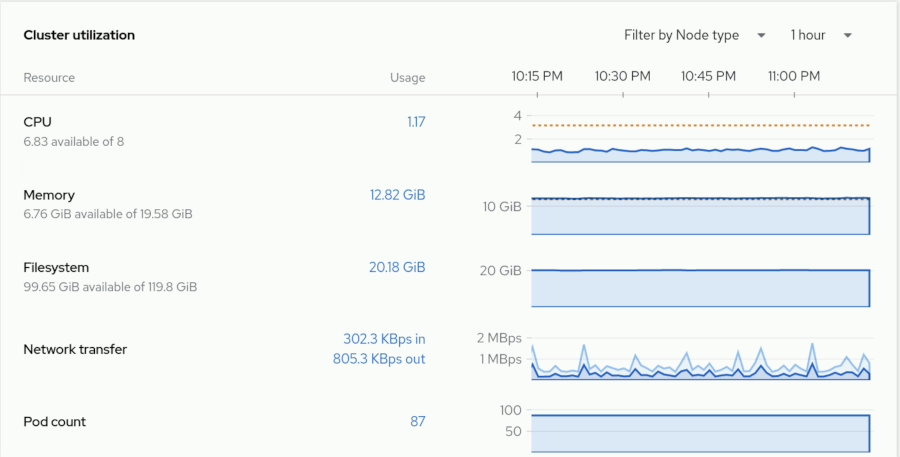
Continue scrolling to view the
Detailssection, including information such as the API version, cluster ID, and Red Hat OpenShift version.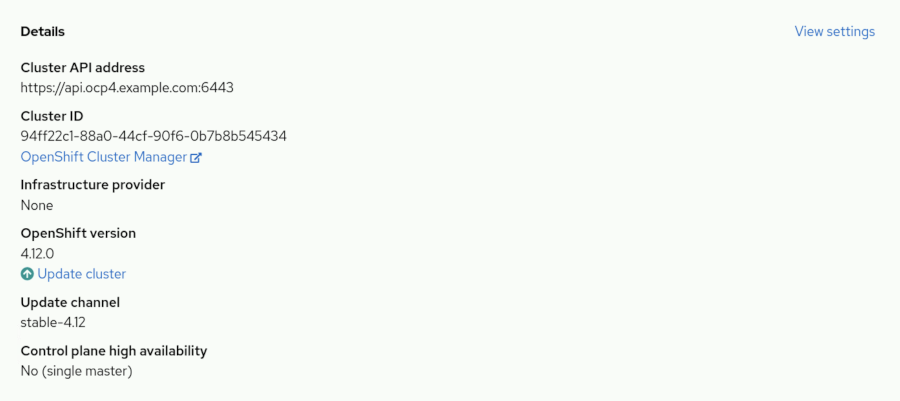
Scroll to the
Cluster Inventorysection, which contains links to theNodes,Pods,StorageClasses, andPersistentVolumeClaimpages.
The last part of the page contains the
Activitysection, which lists ongoing activities and recent events for the cluster.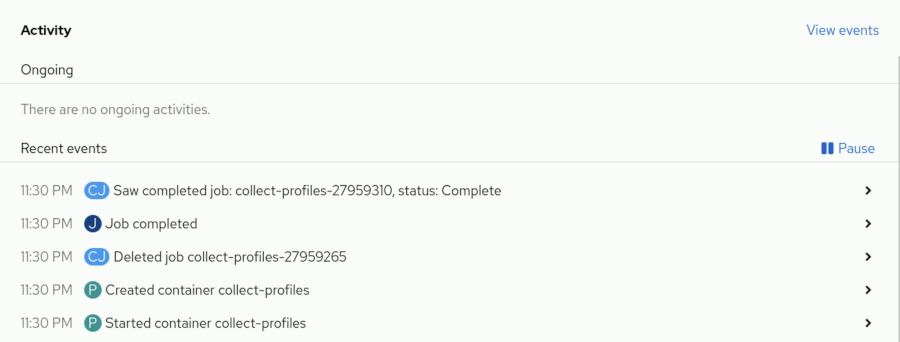
Use the OpenShift web console to access the terminal of a cluster node. From the terminal, determine the status of the
kubeletnode agent service and theCRI-Ocontainer runtime interface service.Navigate to Compute → Nodes to view the machine that provides the cluster resources.

NOTE
The classroom cluster runs on a single node named
master01, which serves as the control and data planes for the cluster, and is intended for training purposes. A production cluster uses multiple nodes to ensure stability and to provide a highly available architecture.Click the master01 link to view the details of the cluster node.

Select the Terminal tab to connect to a shell on the
master01node.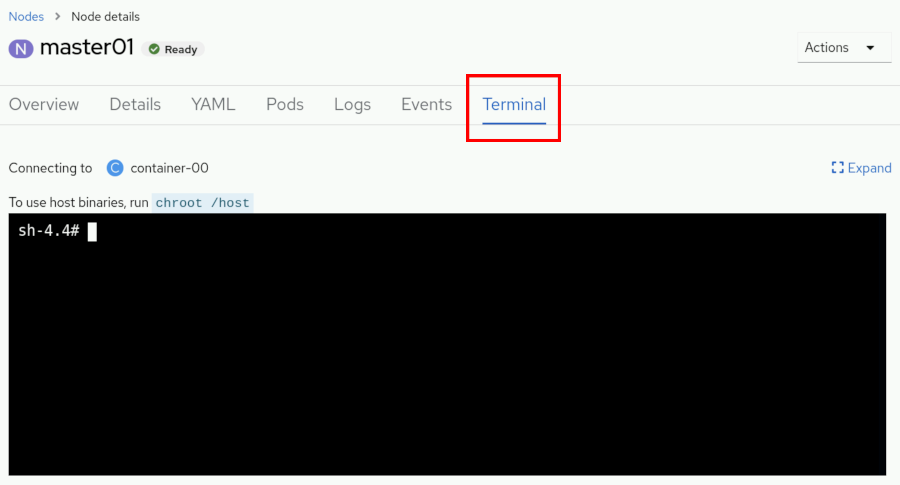
The shell on this page is interactive, and enables you to run commands directly on the cluster node.
Run the
chroot /hostcommand to enable host binaries on the node.View the status of the
kubeletnode agent service by running thesystemctl status kubeletcommand.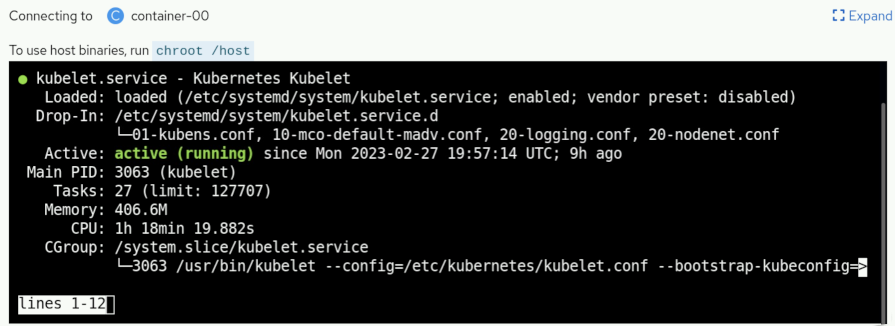
Press q to exit the command and to return to the terminal prompt.
View the status of
CRI-Ocontainer runtime interface service by running thesystemctl status criocommand.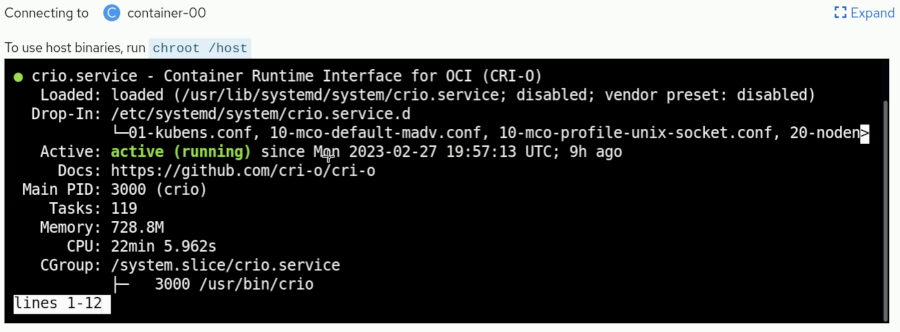
Press q to exit the command and to return to the terminal prompt.
Inspect the cluster monitoring and alert rule configurations.
From the OpenShift web console menu, navigate to Observe → Alerting to view cluster alert information.

Select the Alerting rules tab to view the various alert definitions.
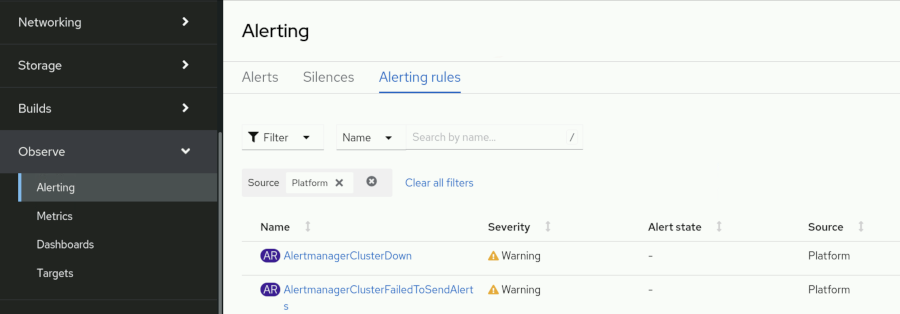
Filter the alerting rules by name and search for the
etcdDatabaseterm.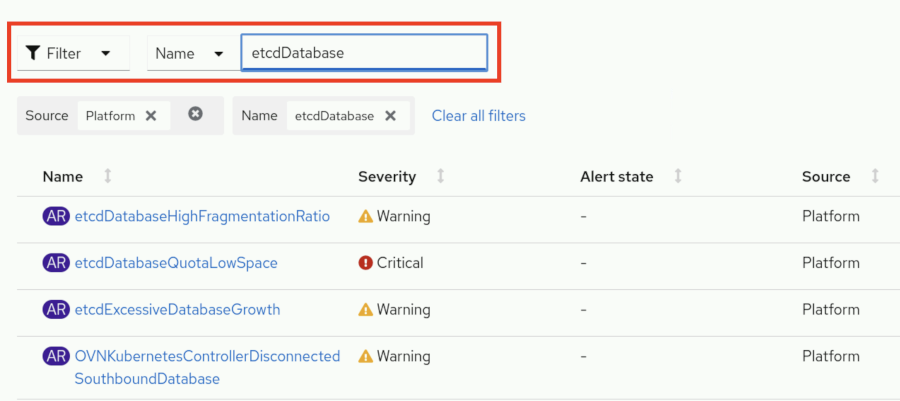
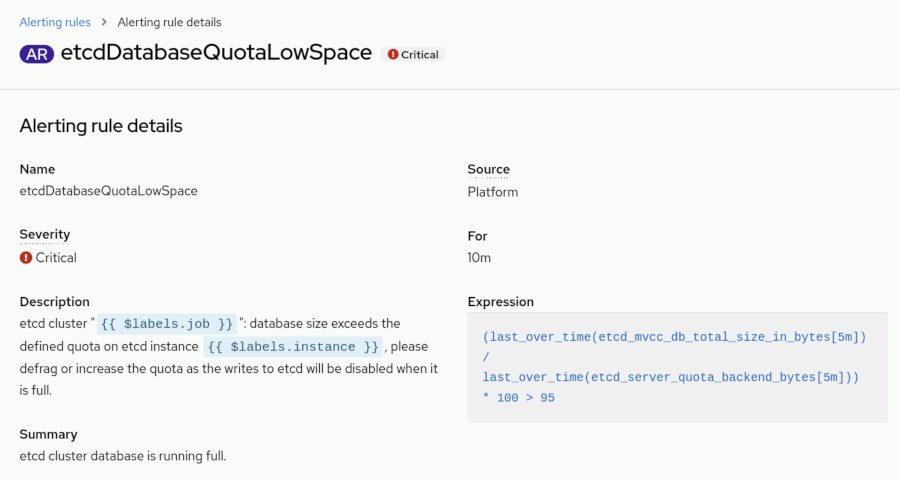
Select the
Criticalalert that is labeledetcdDatabaseQuotaLowSpaceto view the details of the alerting rule. Inspect theDescriptionandExpressiondefinition for the rule.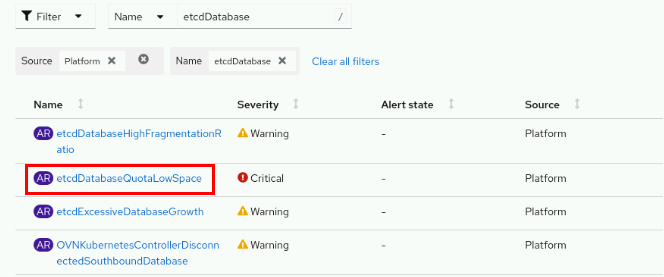
Inspect cluster metrics and execute an example query.
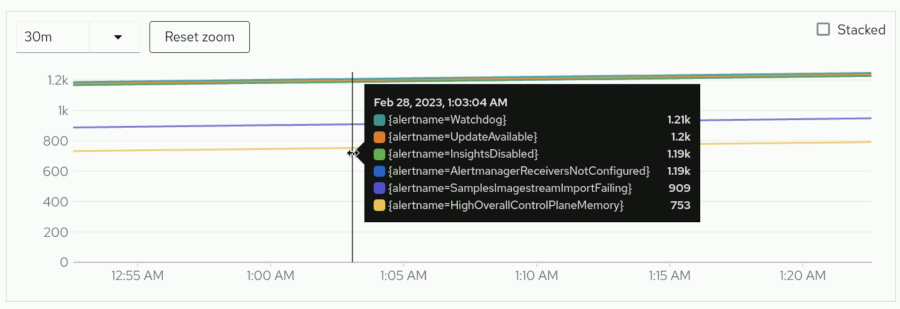
Navigate to Observe → Metrics to open the cluster metrics utility.
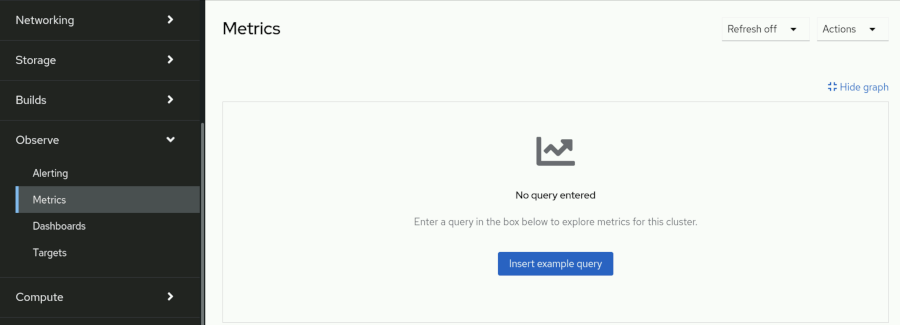
Click Insert example query to populate the metrics graph with sample data.
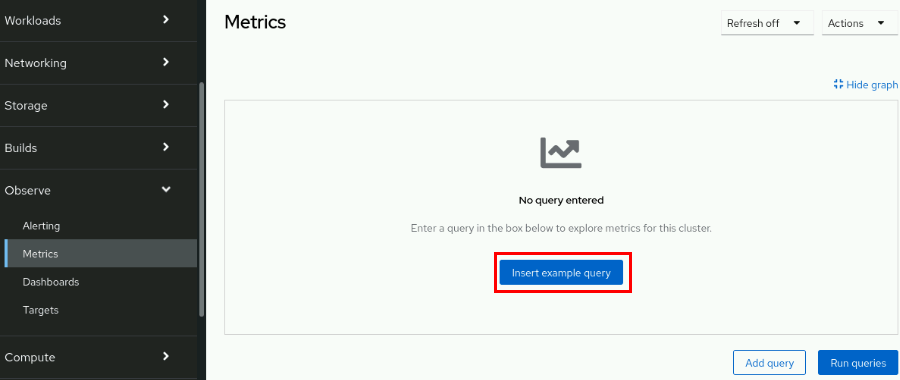
From the graph, hover over any point on the timeline to view the detailed data points.
View the cluster events log from the web console.
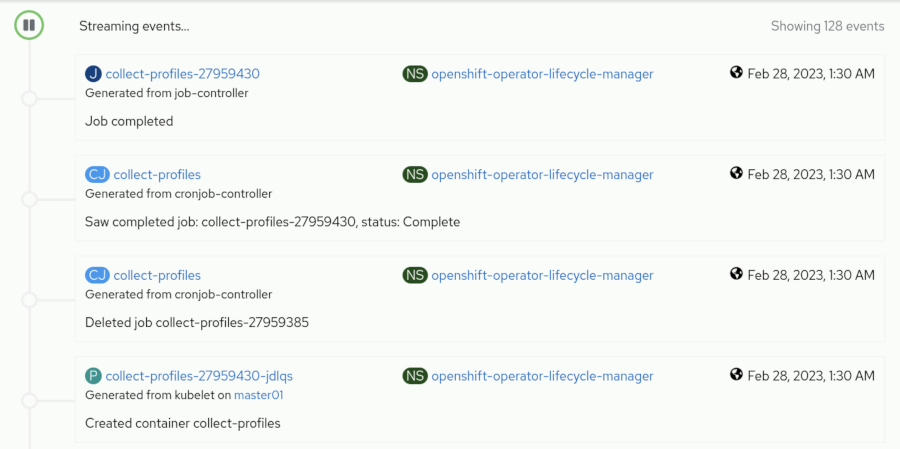
Navigate to Home → Events to open the cluster events log.

NOTE
The event log updates every 15 minutes and can require additional time to populate entries.
Scroll down to view a chronologically ordered stream that contains cluster events.
NOTE
Select an event to open the
Detailspage of the related resource.
Filter the events by resource name, type, or message.
From the Resources drop-down, use the search bar to filter for the
jobterm, and select the box labeled CronJob to display events that relate to that resource.Continue to refine the filter by selecting
Warningfrom the Type drop-down.Filter the results by using the Message text field. Enter the
missed start timetext to retrieve a single event.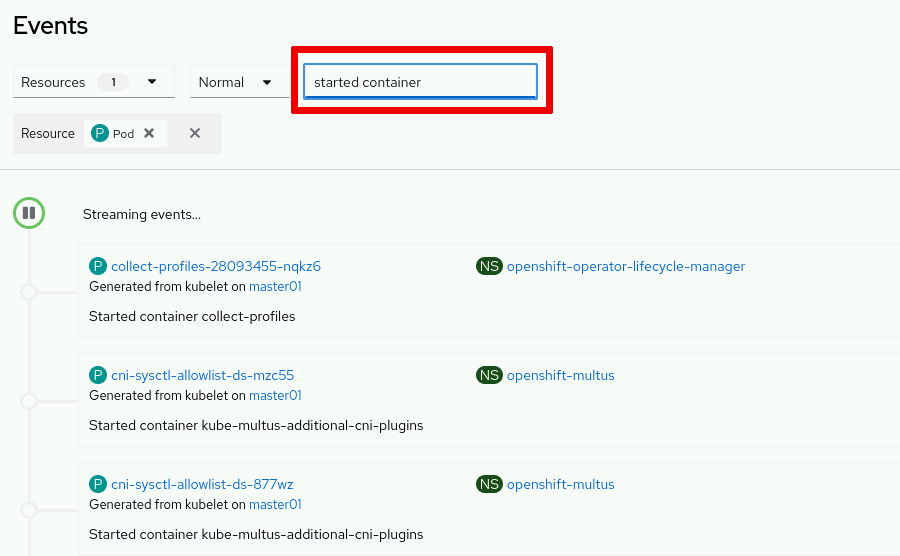
Finish
On the workstation machine, use the lab command to complete this exercise. This step is important to ensure that resources from previous exercises do not impact upcoming exercises.
[student@workstation ~]$ lab finish intro-monitor
